Resource Load Chart
The Resource Load Chart displays estimated allocations per resource in the selected period. Using this chart, the project manager can drill down further to identify available resources and problematic allocations. You also have the ability to add resource calendar exceptions to set working times, client meetings or holidays that can affect your project schedule.
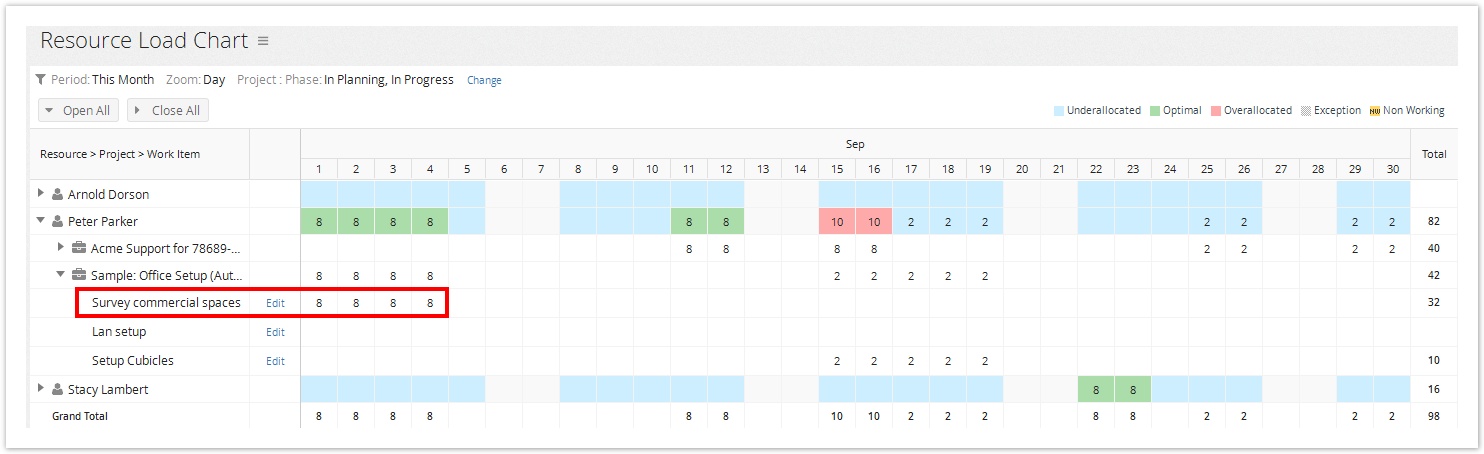
Let's look at an example highlighted in the screenshot above:
A resource Peter Parker is assigned to a task 'Survey commercial spaces'
- Task Schedule: From 1st to 4th in a month i.e 4 days
- Work: 32 h (Work)
- Allocation: 100%
So, the allocation for Peter (Hours (Est)) will be divided across the planned dates for the task (32h / 4d) which is as follows:
| 1st | 2nd | 3rd | 4th |
|---|---|---|---|
| 8 | 8 | 8 | 8 |
As the resource is optimally allocated, the legend for the resource shows up in green for that assignment.
To view the Resource Load Chart:
- From the main menu, click on View.
- The report will be listed here as a favorite report by default.
Green: Resource is optimally allocated.
Blue: Resource is under allocated.
Red: Resource is over allocated.
Gray: Exceptions.
Yellow (NW) : Non-Working.