Scatter Chart
Scatter Chart
- Beena Wankar (Unlicensed)
- Rashmi Likhite
Owned by Beena Wankar (Unlicensed)
Last updated: Sept 22, 2016 by Rashmi Likhite
To Create a Scatter Chart:
- From the main menu, click Reports > All Reports.
- In the new pop-up, from the New Report drop-down list select a report template.
- In the new pop-up, enter the name of the report in the Name* box.
- In the Description box, type the description.
- From the Visible to Users drop-down list, select the appropriate option with whom you want to share the report.
- From the Visible to Clients drop-down list, select the clients with whom you want to share the report.
- In the Filters section, from the Add filter... drop-down list, select a filter. The selected filters are displayed under the Filter column.
- Select the Prompt? check box if you want to display the selected filters in the report output window.
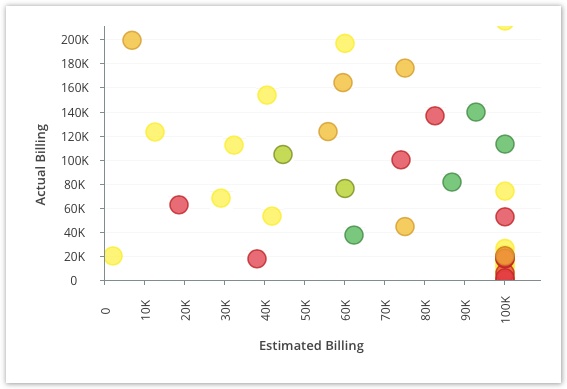
- In the View tab under Chart section, select Scatter.
- In the X Axis indicates drop-down list, select an option.
- In the Y Axis indicates drop-down list, select an option.
- In the Size of scatter indicates drop-down list, select an option.
- In the Color indicates drop-down list, select an option.
- Click Save. The scatter chart is displayed.
, multiple selections available,