Report Views Types
There can be a lot of information which project managers need to view and analyze during the planning and execution phase of the project. Reports can be created to show information in tabular form or chart reports. Celoxis provides a variety of different visualizations based as needed.
A popular one is drill-down graphical charts which present a large and complex chunk of information in a concise and simplified form. This allow the managers to see a high level chart view and quickly click these drill-down charts to view the detailed tabular task information right below these charts. Celoxis also provides the option to create charts on Custom Fields thereby tailoring the reports to your business needs.
Additional columns:
Celoxis also provides some additional columns on certain date fields, where the month or year part of the date is crucial in reporting and decision making. These columns can be used in sorting and grouping.
The following date fields will have Month and Year components:
Entity | Column name |
|---|---|
| Project | Deadline |
| Project | Start |
| Project | Any custom field of type 'Date' |
| Task | Any custom field of type 'Date' |
| Time Entry | Date |
| Expense | Created |
| Apps | Created |
| Apps | Any custom field of type 'Date' |
Let 'X' be an entity of type "Project", then selecting X: Month will be shown as the date without the date and X: Year will be shown as the year without the date and month.
For example, if date format is May-12-2014, then Month will be May-2014 and Year will be 2014. If however, the display date format is 2014-05-12, the month would be shown as 2014-05.
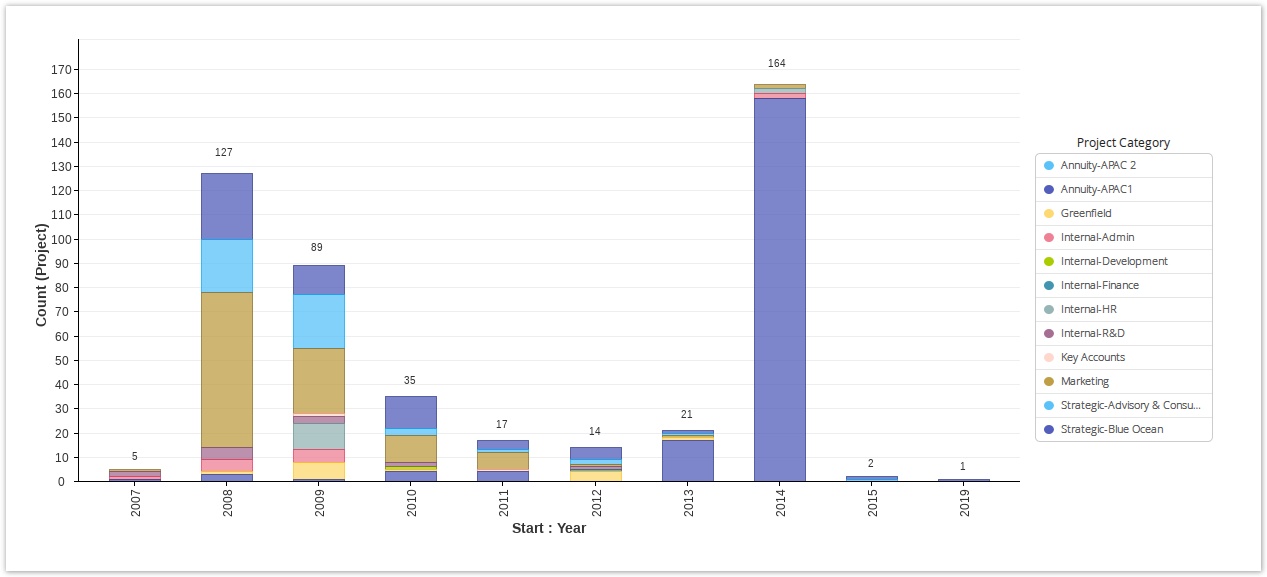
The above screenshot is an example of understanding project trends in an organization. Looking at this, the management can understand how different projects stacked up over the past years.